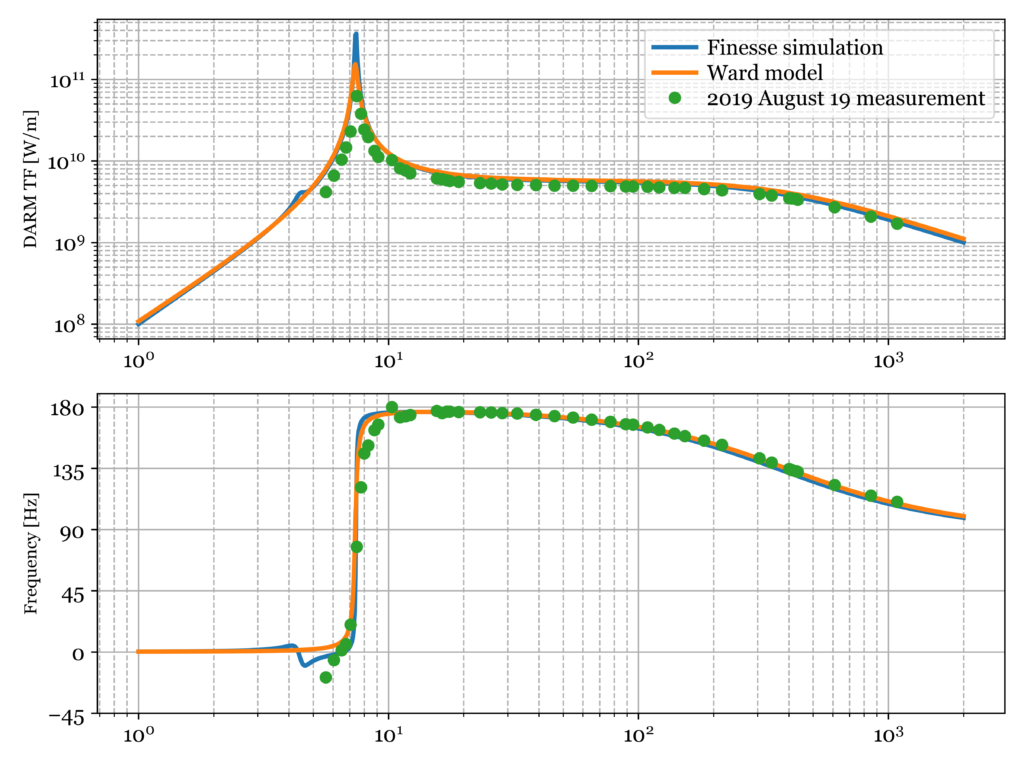
Andreas asked me for a couple of plots for the Finesse home page: http://www.gwoptics.org/
I have dug up a few plots, as well as made a .svg diagram of the Advanced LIGO interferometer.
Proposed Advanced LIGO diagram for the landing page: https://logbooks.ifosim.org/pykat/wp-content/uploads/sites/4/2020/06/full_ifo.svg
P_\mathrm{as} = E_\mathrm{lo} E_\mathrm{sig}
https://ccahilla.github.io/ward_vs_finesse_DARM_model.svg
The above plot has an interactive legend, but I could not embed that functionality in this logbook post. The full .svg is on my github page, link above.
EDIT: Added the same plot but without the title
Also updated the drawing:

