There is a somewhat “hidden” feature in Pykat which is capable of showing you an approximate visualisation of your model. It may not be available on all systems, e.g. Windows.
This feature is available in two ways:
Via notebook
In a Jupyter notebook, you can view your interferometer using the following code:
from pykat.tools.plotting.graph import NodeGraph
nodegraph = NodeGraph(kat)
nodegraph.view_pdf()
In the example above, the kat object is your Pykat model. If you have called it something else, e.g. kat2, you should of course update this variable.
Via command line interface
You may not know this, but by installing Pykat you have also installed a command line interface. Within a Conda terminal/prompt, you can type pykat then enter, and you will be presented with a help screen for the command line interface. Normally you run a Finesse model this way using pykat FILE.kat where FILE.kat is your input file. Note that this interface does not support Python-based scripts, such as those that you write in your Jupyter notebooks. One option is --display-graph, which runs the model contained in the specified FILE.kat parameter and displays the graph in your PDF viewer.
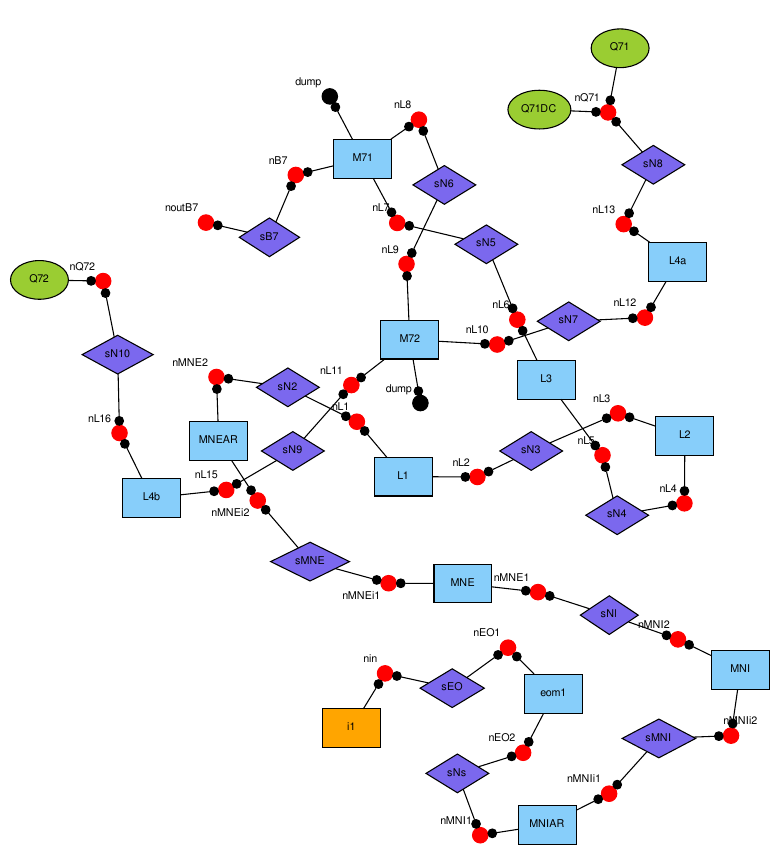
Output
The output looks something like this (it will open a PDF on your computer):